How Can We Equitably Prepare for Climate Change? To Dr. Ashley Johnson, a map can show so much more than locations of cities, landmarks and waterways. A map can inform decision-making that has a real impact on people’s livelihoods, and it can show us areas that are in the direst need of additional resources.
By Katie Garwood
Through a collaboration with the St. Johns Riverkeeper, Dr. Johnson’s research was able to do just that, as she created maps for the organization focusing on justice, equity, diversity, and inclusion (JEDI).
“A picture’s worth a thousand words, but a map is really worth a million because you can tell a story using a map,” Johnson said.
When heavy rains and storm surges roll into Jacksonville, the flood waters that come could affect anyone, whether they live on the most expensive property in the city or in a less affluent neighborhood.
But some areas — those with a lack of proper, functioning infrastructure — may not be as equipped as others to handle those storm surges, leaving them far more susceptible to flooding than others.
That’s what Johnson, an associate professor of geography and Geographic Information System (GIS) expert, set out to examine. Where are the areas in the St. Johns River watershed that are most vulnerable to flooding, and which areas need updated storm drains, retention ponds and other flood mitigation infrastructure?
“Sea-level rise is not going anywhere, and it’s only going to get worse,” Johnson said. “I think it’s important to shine a light and identify the areas that need more attention. Maybe they’ve been neglected for whatever reason, and now people can’t get in and out of their homes because of flooding.”
Through her work with the Riverkeeper, Johnson has mapped the North Jacksonville neighborhoods along the Trout and Ribault rivers, which are predominantly populated by minority residents and are among the most vulnerable neighborhoods in the city. These communities include areas of high socioeconomic vulnerability that, according to the report, “occurs when social, political and economic processes combine to create increased exposure to, and impact from, hazards for some populations.”
“Now it’s just a matter of using those results to support decision-making along the river and for prioritizing programs,” Johnson said.
But it’s not just areas with high social vulnerability that are susceptible to flooding. Affluent neighborhoods, like those in San Marco or along the beaches, face a high risk of flooding as well. And areas that may be safe now are projected to be highly vulnerable by 2050, according to the maps.
“That just drives home the point that we’re all in this together,” Johnson said. “And that circles back to this idea of equity. I just think it’s important that we identify all neighborhoods, not just those that are affluent or are economically vulnerable. I think everybody should be aware of what they’re swimming in and what their home is adjacent to. The fact of the matter is we’re all vulnerable when it comes down to it.”
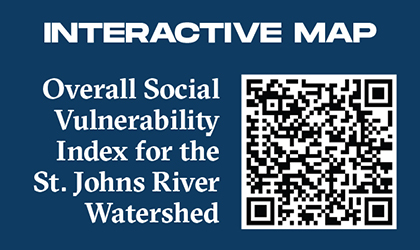
So far, Johnson has completed vulnerability maps for Duval County and the lower St. Johns River Basin, which extends south of Jacksonville to Lake George in Central Florida. In the summer of 2024, she completed similar maps for the entire 9,000-square-mile St. Johns River watershed. The goal of the project is to educate communities all along the St. Johns River about how sea level rise will impact them, to identify solutions and strategies are most effective against rising waters, and to provide help to those communities that are not sure what to do.
“It’s all data-driven. It’s not anybody’s opinion or political view; it’s just data,” Johnson said. “There are places that need attention that may not have the political capital needed to make change happen. So, as academics and as scientists, it’s part of our responsibility to provide data-based resources to support decisions or the people who are making those decisions about our communities.”

